Wed Oct 12 2022
RabbitMQ Observability: Get More Out Of Your Message Broker
by
Fritz Stauffacher

RabbitMQ is the most deployed open source message queue in the world. RabbitMQ's wide use can be attributed to its reliability, ease of deployment, great programming libraries, and excellent management UI.
I have managed production RabbitMQ clusters with heavy workloads at several companies. Observability into clusters and events is the key to running the system for years on end without issue.
Overall System
The first step to maintaining a production RabbitMQ cluster is to get insight into the cluster performance metrics.
RabbitMQ management UI is the fastest way to get an overview of your cluster.
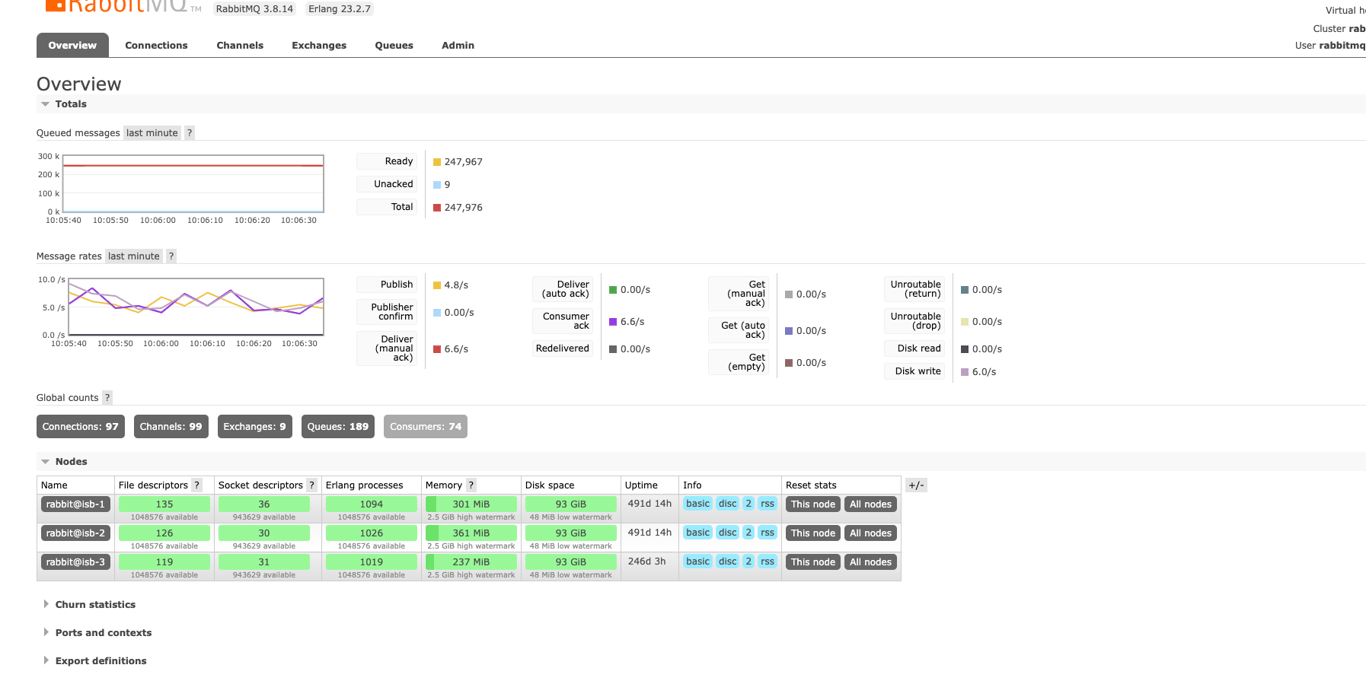
The built-in management UI allows you to quickly view events coming into the cluster, the health of brokers, consumer connections, and the topology of exchanges and queues.
Long-term Metrics and Alerting
For production, you will want to use software that can track metrics over a long timeline and trigger alerts. The following platforms will all expose the important metrics.
Prometheus with Grafana
Is an open-source solution for monitoring RabbitMQ. Configuring Prometheus and Grafana does take quite a bit of work. The folks over at RabbitMQ have a great guide on how to get started.
Datadog
Datadog is a paid platform that is extremely easy to set up and expose metrics in. I really enjoy using the simplicity and quick turnaround time. See their install guide here.
New Relic
New Relic is another platform as a service that is easy and quick to set up. See the configuration guide here.
Key Metrics
Whichever platform you select. These are the metrics that are critical to the health of the cluster. Datadog has a pretty more in-depth list you should consider adding to your alerts as well.
| Metric | Description |
|---|---|
| rabbitmq_resident_memory_limit_bytes | RabbitMQ by default sets a 40% memory limit of total node memory. All connections will be blocked if this threshold is reached. See more here. |
| rabbitmq_disk_space_available_limit_bytes | By default 50MB is required to be free on the database partition. Once the threshold is reached all connections will be blocked. See more here. |
| rabbitmq_process_open_fds | Ensure this is not exceeding the limit of open files allowed on your linux nodes. |
| rabbitmq_queue_messages_unacked | Ensure consumers are processing messages. You may have a problem with your application. This can also quickly lead to memory issues. |
| rabbitmq_queue_messages | Determine if messages are stacking up. Set a threshold to cleanup acked messages. This can lead to memory/storage issues very quickly. |
| rabbitmq_erlang_uptime_seconds | Watch this for node restarts. |
| rabbitmq_process_open_tcp_sockets | Set an alert around this based on what you think an upgrade may be needed. |
| rabbitmq_queues | Set a reasonable threshold for this. If triggered, determine if ephemeral or old queues need to be cleaned up. |
| rabbitmq_consumers | Set a reasonable threshold on this. Determine if an upgrade is needed based on the size of the application. |
| rabbitmq_connections | Set a reasonable threshold. Determine the source for an influx in connections. Could this be the result of an open firewall or a security scan? Or has my application grown? |
Monitoring the metrics above should be enough to ensure you solve problems before they become an issue. The table above assumes you also monitor the nodes for basic things like load, CPU, uptime, and the RabbitMQ load balancers for any issues.
Event Tracing
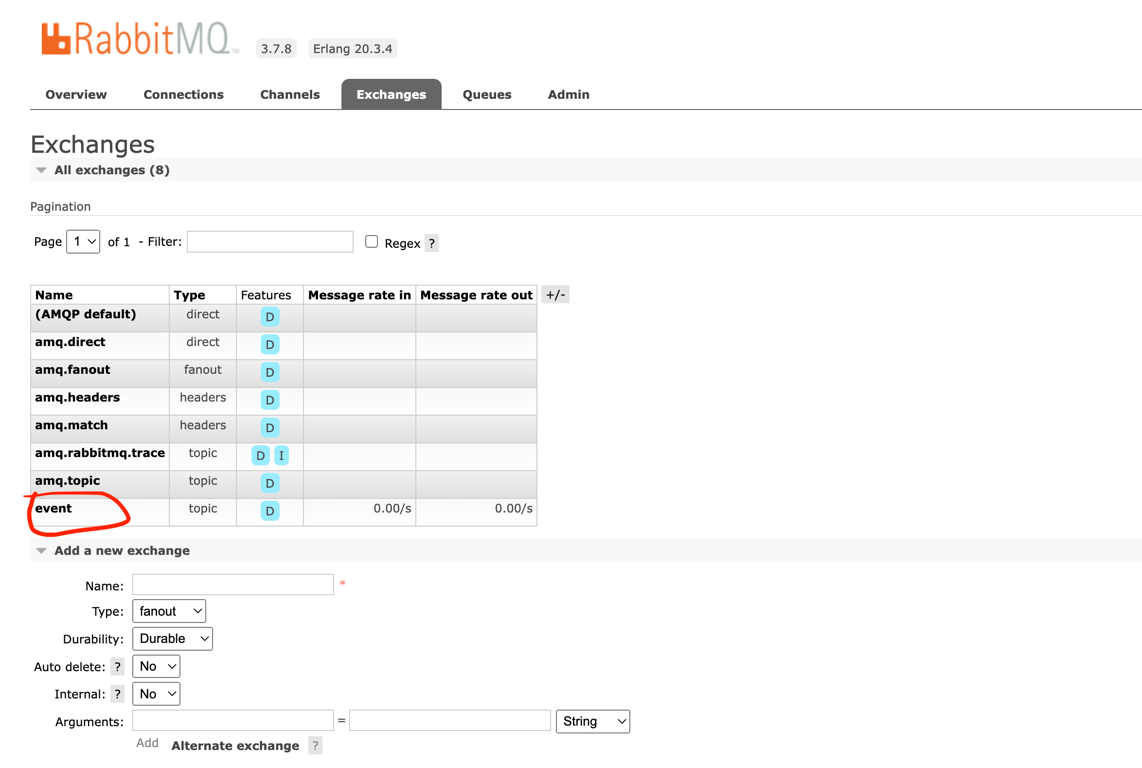
It's crucial to be able to review the events your application is generating and confirm they are getting to the correct exchanges and queues.
We will look at a few ways to examine messages that are coming into the exchange 'event'.
RabbitMQ Firehose
RabbitMQ Firehose tracer is RabbitMQ's native solution for capturing messages. All events are logged to a text file and can be viewed via the RabbitMQ management UI.
Enable the RabbitMQ tracing plugin by executing the following on each RabbitMQ broker:
rabbitmq-plugins enable rabbitmq_tracing
Create a new trace via the management UI.
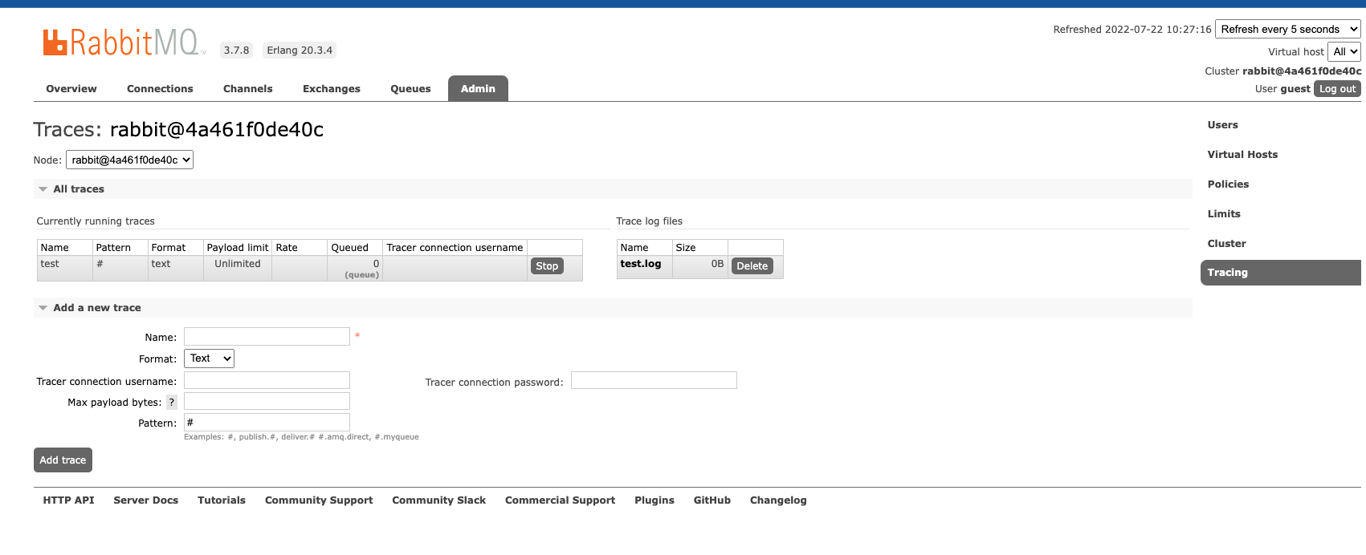
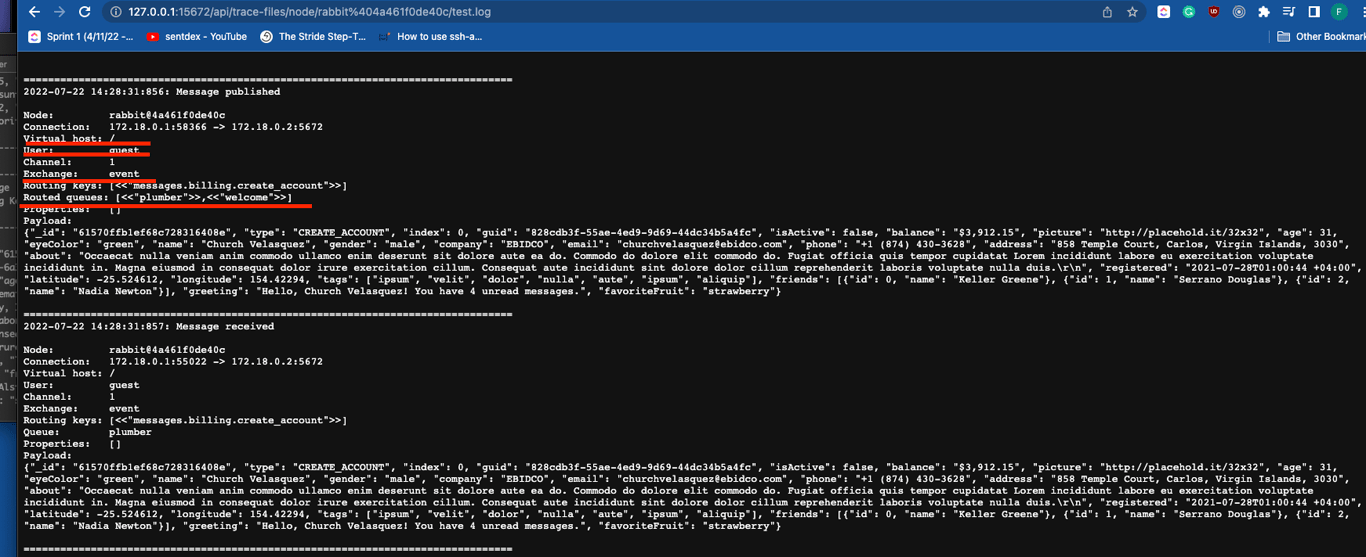
Examine the events by clicking on the trace_name.log in the newly created trace.
Plumber CLI
Plumber is an open source client that supports multiple message busses and can be used for examining/writing to RabbitMQ exchanges.
Example reading all messages that come into exchange event:
plumber read rabbit --address="amqp://guest:guest@localhost:5672" --exchange-name=event --binding-key=# --queue-name=plumber -f
Example Output:
------------- [Count: 193 Received at: 2022-07-21T15:21:01-04:00] -------------------

+----------------------+--------------------------------------------------------------+
| Exchange             |                                                        event |
| Routing Key          |                              messages.billing.create_account |
| AppID                |                                                         NONE |
+----------------------+--------------------------------------------------------------+
{"_id": "61570ffb98cadddacc1cd79b", "type": "CREATE_ACCOUNT", "index": 95, "guid": "ddbf3c70-27d1-4fa6-9647-18070ae48210", "isActive": true, "balance": "$2,495.01", "picture": "http://placehold.it/32x32", "age": 30, "eyeColor": "blue", "name": "Curtis Mosley", "gender": "male", "company": "UNDERTAP", "email": "[email protected]", "phone": "+1 (877) 521-3653", "address": "502 Pierrepont Street, Walton, Arkansas, 1918", "about": "Reprehenderit nulla dolore amet sunt elit fugiat nulla minim ad velit. Do sint aute excepteur consequat sunt cillum ex veniam Lorem minim nisi. Enim pariatur cillum anim eu elit reprehenderit deserunt cupidatat ullamco fugiat. Et ullamco in dolore duis enim sint tempor adipisicing qui dolor ea amet do adipisicing. Ad dolor amet deserunt consectetur eu laboris sint commodo elit commodo.\r\n", "registered": "2014-02-19T02:41:05 +05:00", "latitude": 41.922125, "longitude": -48.057853, "tags": ["dolore", "ut", "mollit", "cupidatat", "proident", "veniam", "sunt"], "friends": [{"id": 0, "name": "Pitts Parsons"}, {"id": 1, "name": "Mollie Palmer"}, {"id": 2, "name": "Browning Barr"}], "greeting": "Hello, Curtis Mosley! You have 6 unread messages.", "favoriteFruit": "strawberry"}
Don't Miss Our Latest Updates
Event Storage
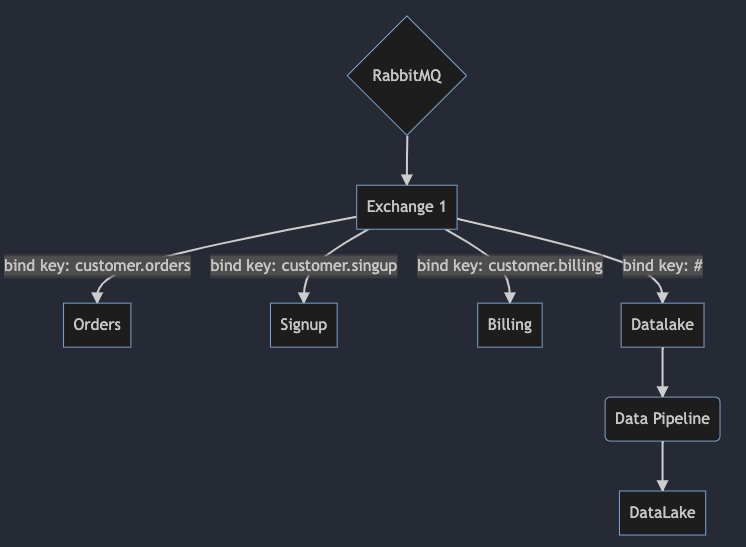
As your team's reliance on RabbitMQ grows you will want to offload messages into a Data Lake for long-term storage. Which can later be used in ETL jobs, semantic monitoring, replay, and search.
Most solutions require a custom consumer, which ships messages to a data pipeline, and then publishes them to a data lake.
Important Features
I'll be using our very own, Streamdal, as an example of features that are crucial for the long-term storage of events.
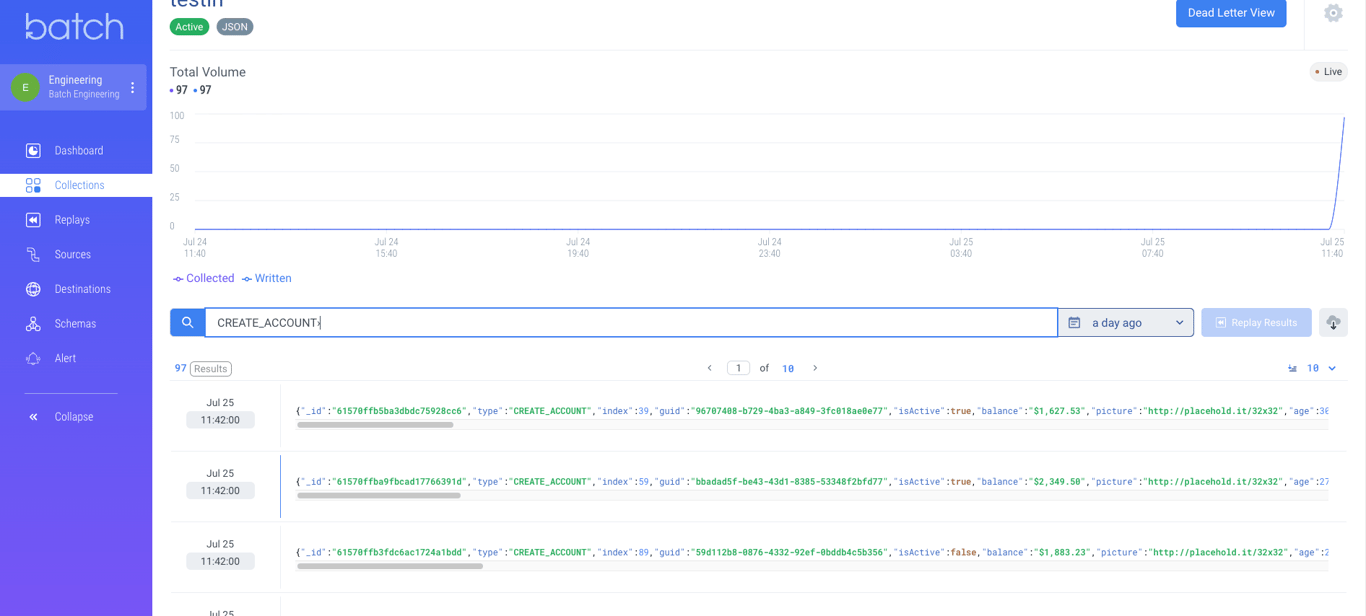
Search
Being able to quickly search across all events allows for rapid troubleshooting.
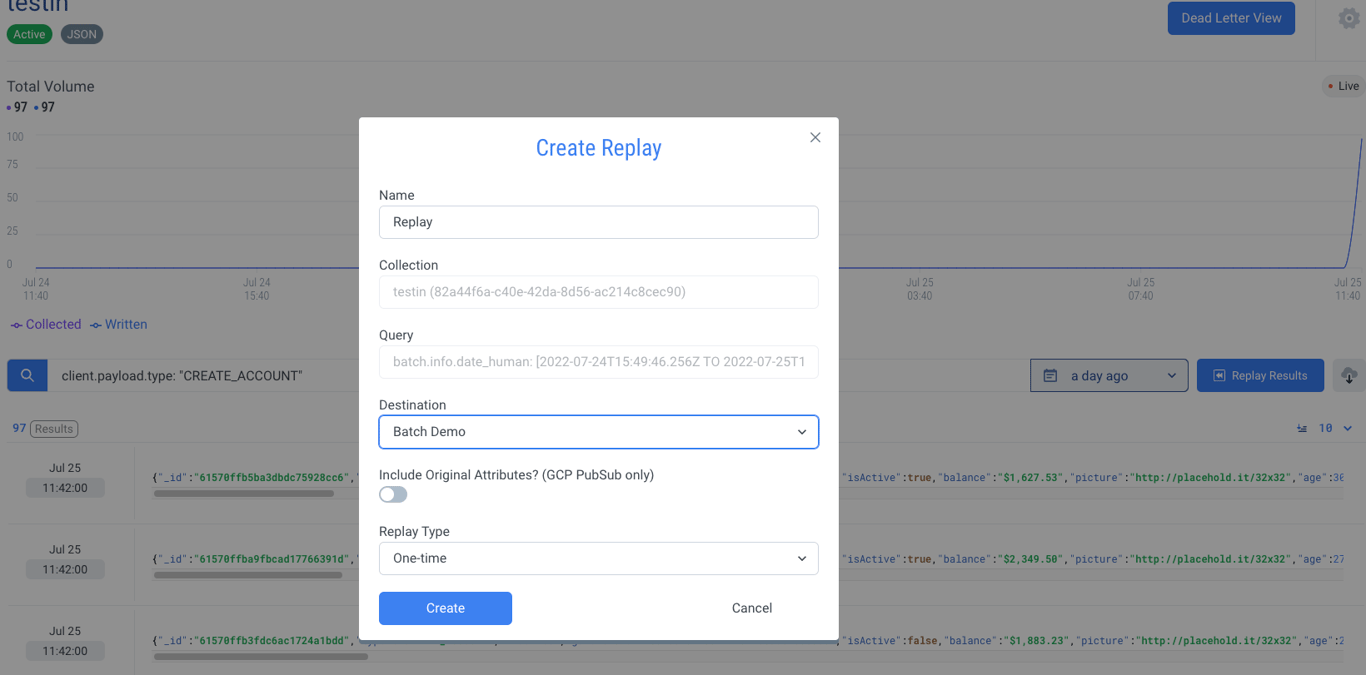
Data Replays
Replaying messages from a specific query is very useful for fixing issues related to bad deploys or outages.
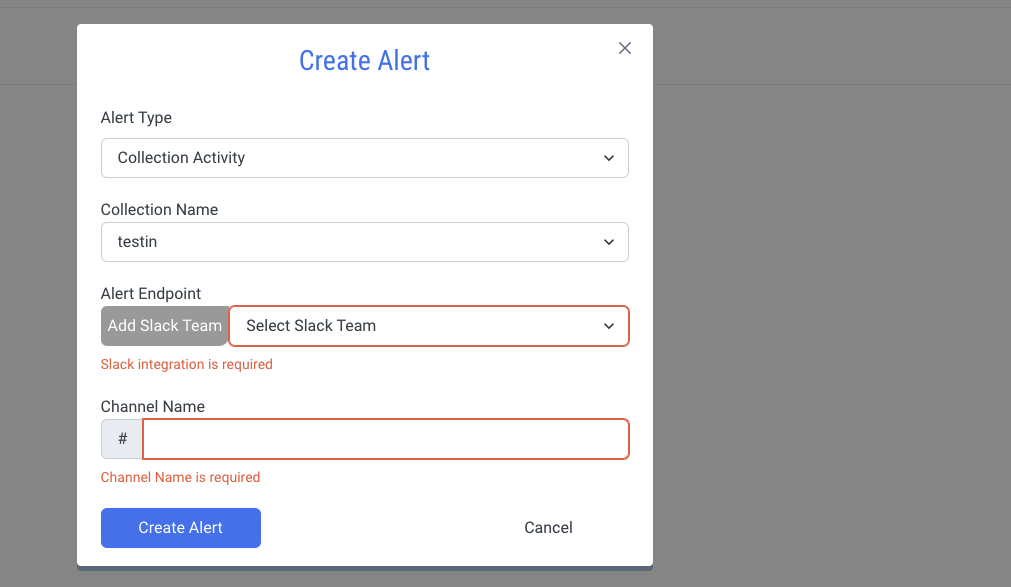
Data Monitoring
Alerting on event attributes such as schemas, anomalies, and throughput can all help catch issues early.
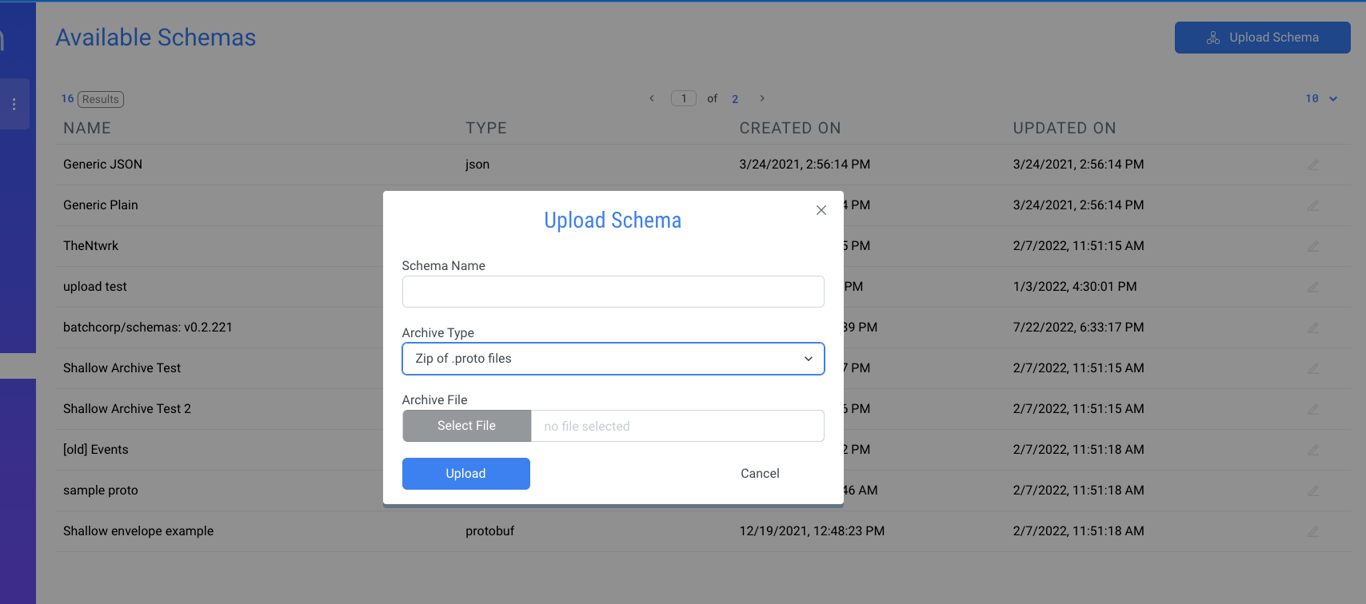
Schemas
Streamdal will deal with schema discovery for JSON automatically but protocols like PROTOBUF require schema details. In most Data Lakes you will have to deal with this step in your data pipeline.
Fritz Stauffacher
DevOps Engineer
Continue Exploring

Thu Jul 27 2023
Data Protection: Challenges and Opportunities
by
Daniel Selans
Explore data protection strategies, key regulations, and the role of automation in safeguarding sensitive information in an ever-evolving digital landscape.

Wed Jul 19 2023
Data Consistency in Distributed Enterprise Applications
by
Daniel Selans
Learn about data consistency in distributed enterprise apps, why it matters, and how to maintain it using validation and real-time data monitoring.